Getting Started
You can install PairPlots from the Julia registry or from the python package index via pip:
using PairPlotsHit enter at the prompt to accept the installation.
If you don't need any customization, the easiest way to get started is to call pairplot with one or more tables or matrices.
using CairoMakie
using PairPlots

# The simplest table format is just a named tuple of vectors.
# You can also pass a DataFrame, or any other Tables.jl compatible object.
table = (;
    x = randn(10000),
    y = randn(10000),
)

pairplot(table)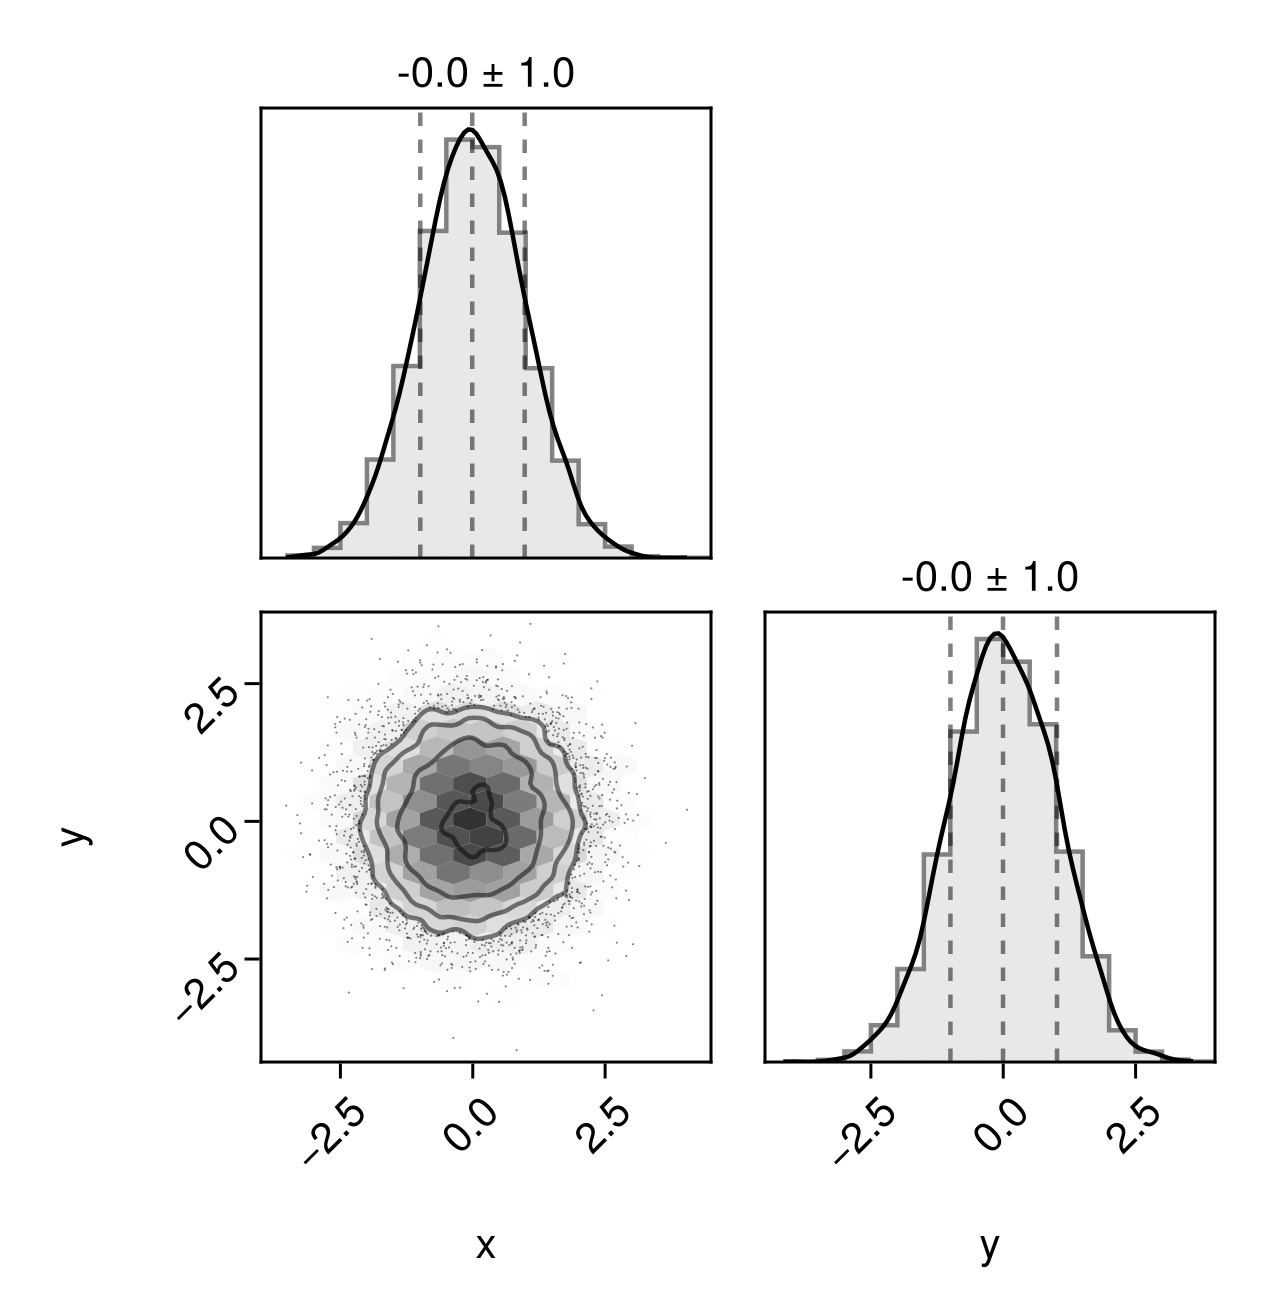
The axis labels are taken from the column names by default, but you can customize them (see Guide).
If you're in a hurry, you can just pass a matrix/2D-array directly.
using CairoMakie
using PairPlots
# Columns are treated as variables, and rows as samples.
mat = randn(10000,6)
pairplot(mat)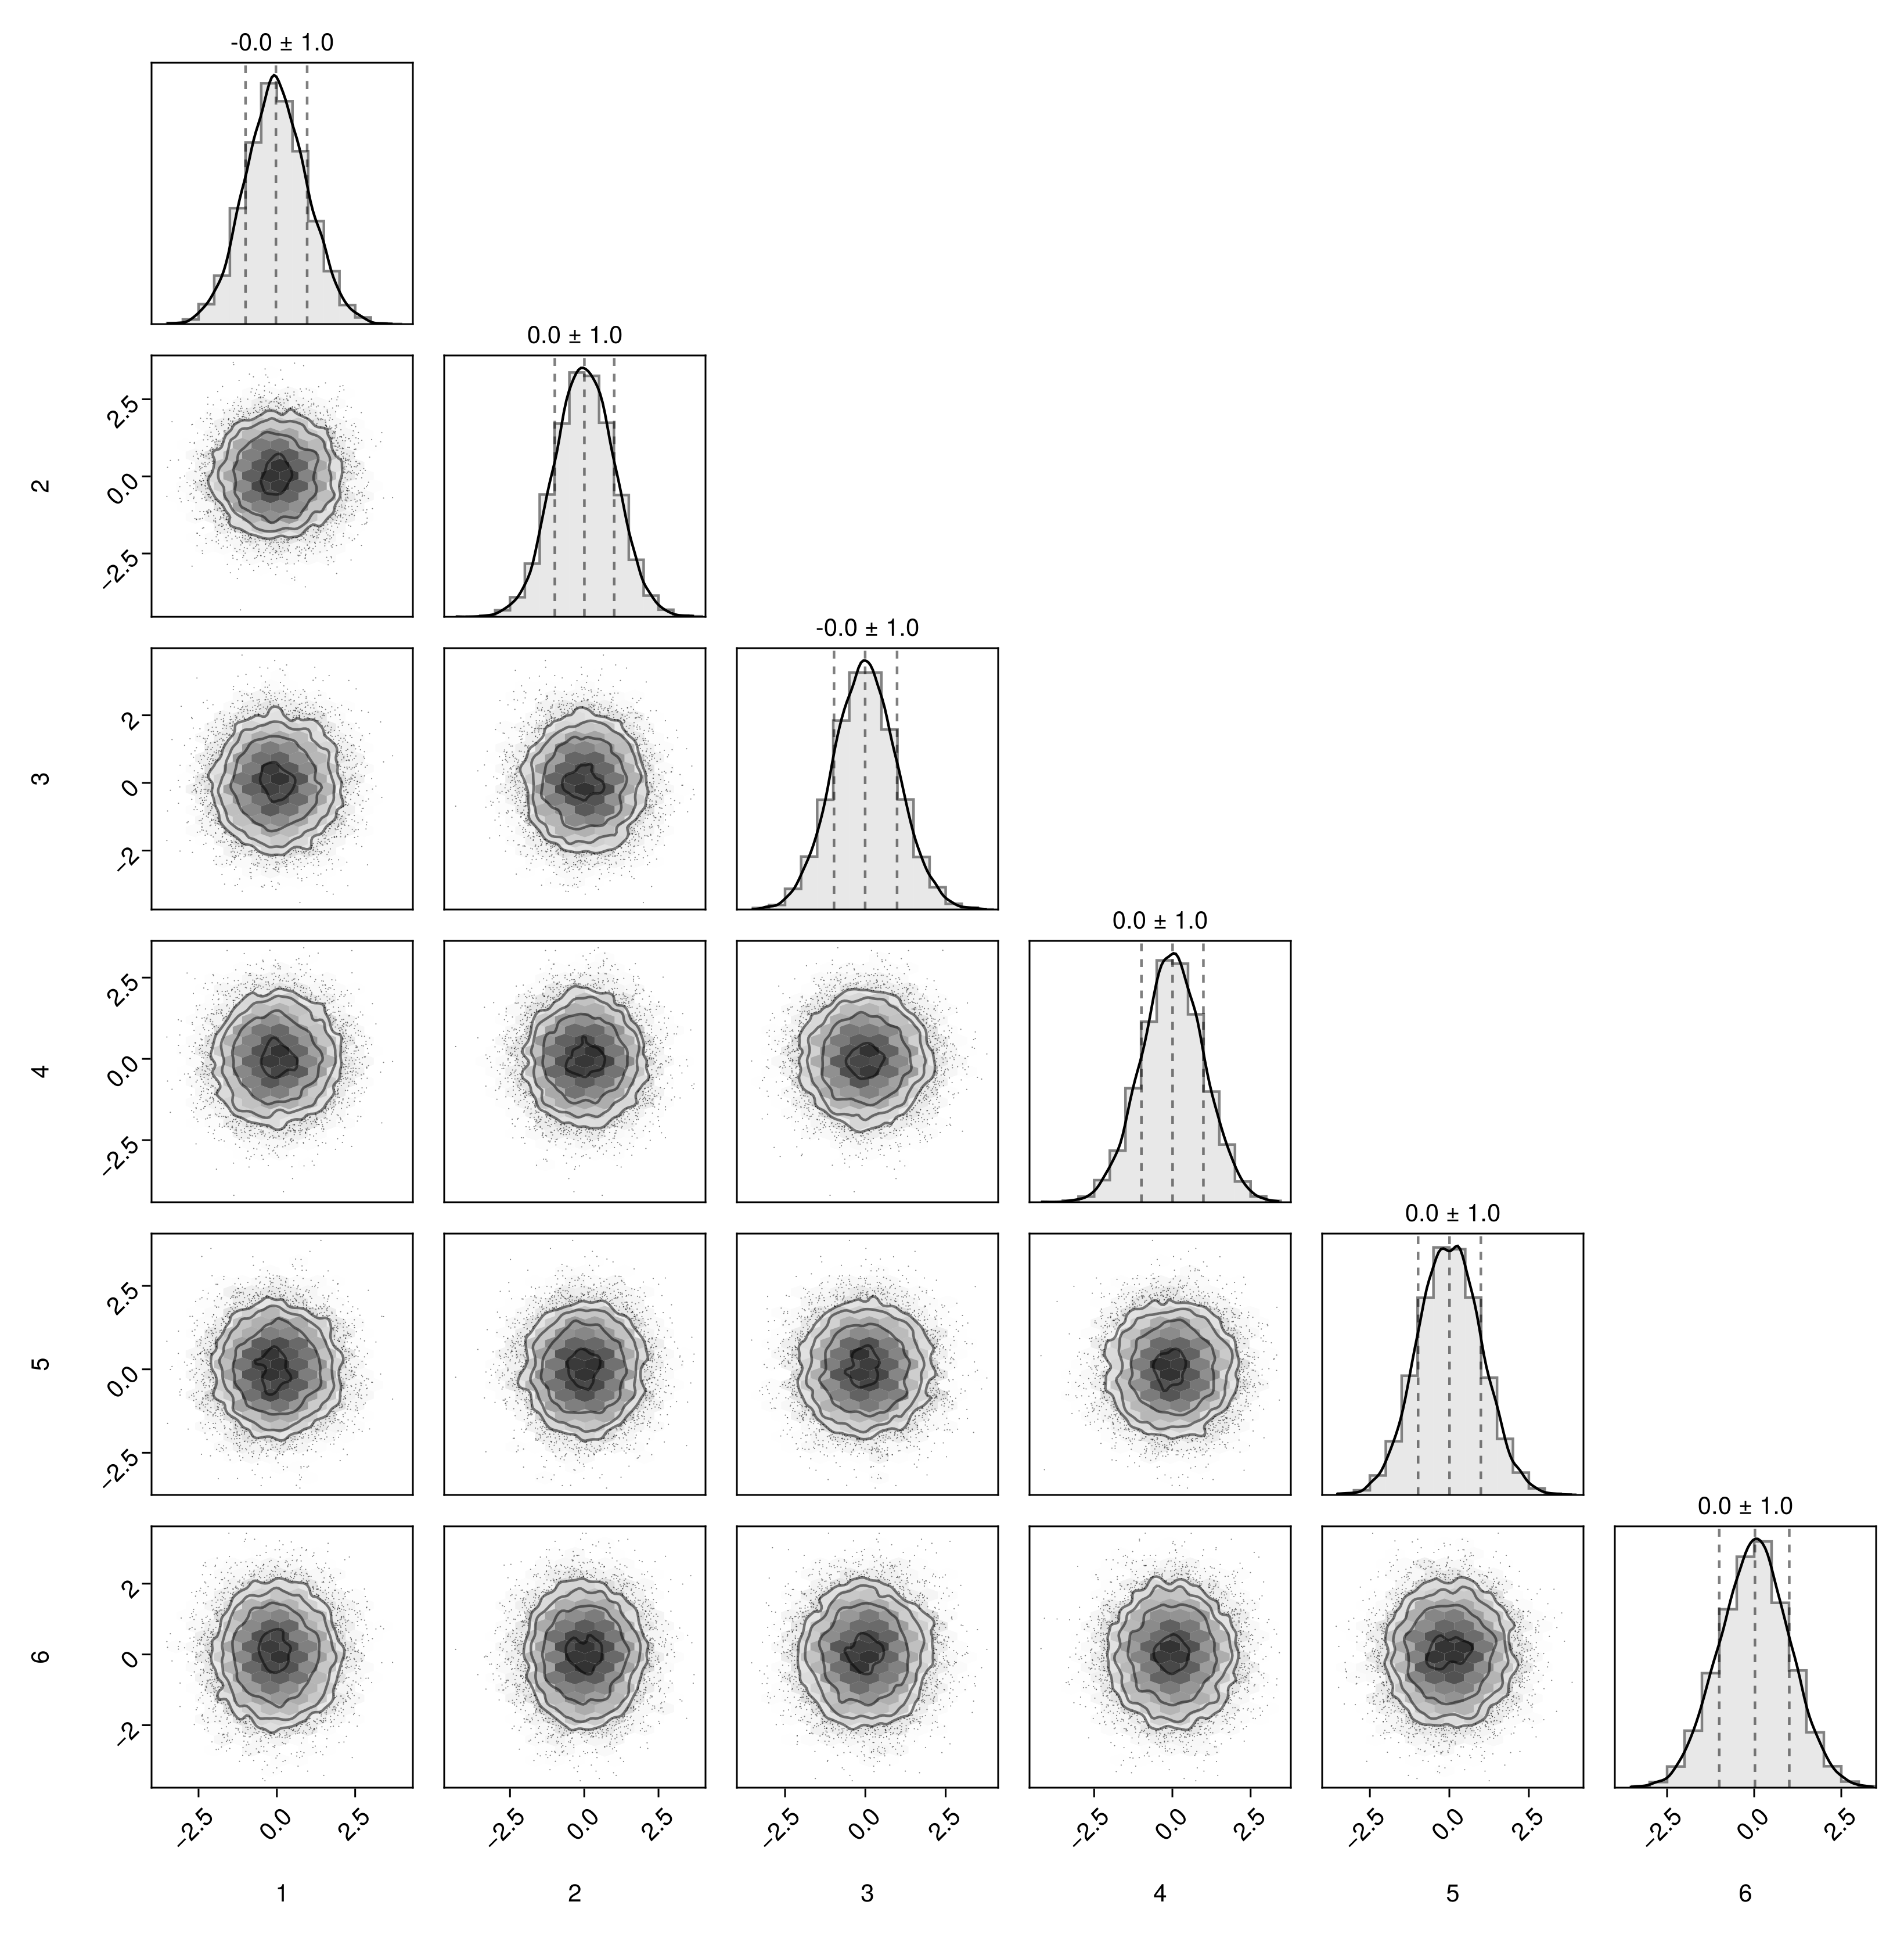
Multiple tables are also supported. They don't have to have the same column names.
using CairoMakie
using PairPlots

# The simplest table format is just a named tuple of vectors.
# You can also pass a DataFrame, or any other Tables.jl compatible object.
table1 = (;
    x = randn(10000),
    y = randn(10000),
)

table2 = (;
    x = 1 .+ randn(10000),
    y = 2 .+ randn(10000),
    z = randn(10000),
)

fig = pairplot(table1, table2)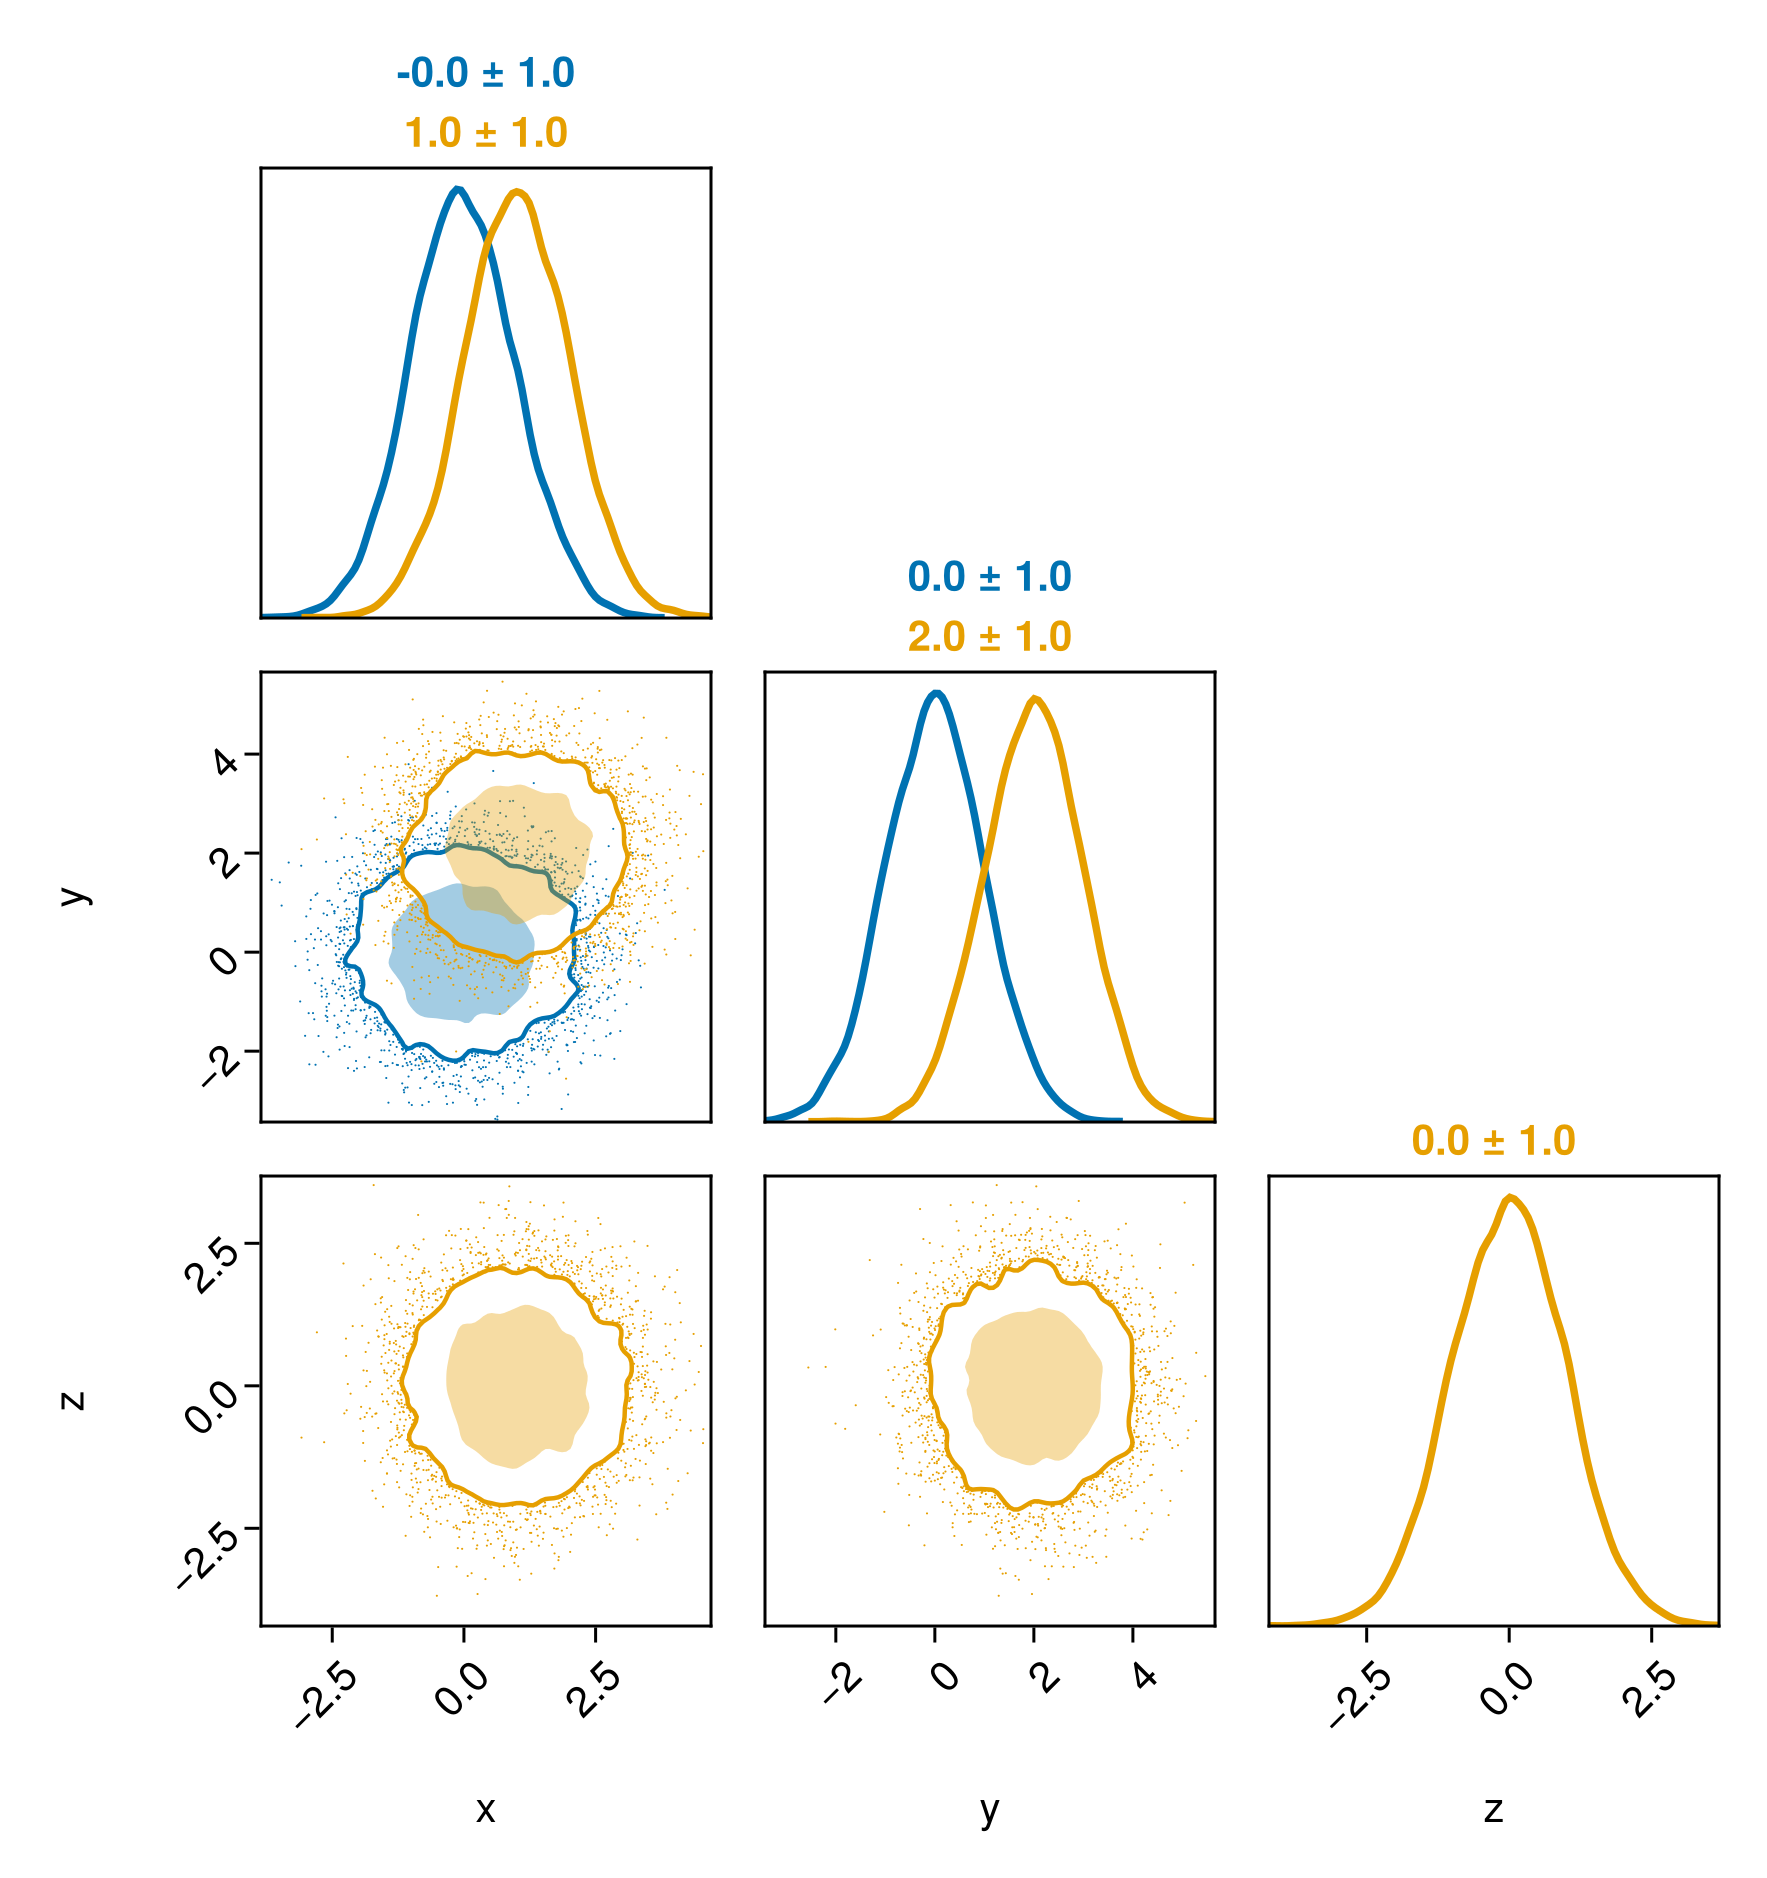
You can save your pairplot like so:
save("myfigure.png", fig)Other formats like .svg and .pdf are also supported.
Resolution
You can increase the resolution of the saved PNG image by passing the px_per_unit keyword argument to save, as in save("plot.png", fig, px_per_unit=3). The higher the number, the higher the resolution (and larger the file).
Interactivity
You can view an interactive figure powered by GLMakie:
using GLMakie; GLMakie.activate!()
pairplot(table)